
By Stefan Superina and Dr. Bob Bell
The National Health Service turns 70
The National Health Service (NHS) celebrated its 70th birthday in July 2018. Like many Canadians, Britons express considerable affection and pride when speaking about their healthcare system.
Launched by the Labour Party in 1948, the NHS was meant to replace a system of voluntary and charitable hospital governance that had become reliant on government funding during wartime. Similar to Canadian Medicare, the NHS was designed to be free at the point of delivery with care based on clinical need, not ability to pay. Importantly, it is funded from general taxation. As with the introduction of Medicare in Canada, there was vehement opposition from doctors to the start of socialized medicine.
Unlike the Canadian system where most physicians are contractors providing service paid for by the government, most specialist physicians in Britain are directly employed by the NHS, along with other health professionals, making the NHS one of the largest employers in the world. Approximately 1.5 million employees work in hospital and community services including 18,000 bureaucrats who provide local commissioning of health services.
In addition, about 130,000 GPs and other staff work in primary care which is funded by the NHS. In most cases, physicians form GP groups rather than being direct employees. GPs practice as partners of the group, or as employees or locums with a standard rate of pay being about 12,500 pounds annually for a half day clinic.
After the passage of the Health and Social Care Act in 2012, local planning and commissioning of both hospital and community services for NHS England has been managed by local Clinical Commissioning Groups (CCGs) that are similar to regional health authorities in Canada.
As of 2019, there were 191 CCGs in England, caring for an average of about 200,000 patients. The CCG is a membership body with local GP groups serving as members. The governing board of each CCG is dominated by GPs with other clinicians including a nurse and a specialist on the board as well as possibly members of the public.
The CCGs are responsible for expenditure of 2/3 of the NHS budget with highly specialized services being managed centrally along with some GP services. In general, primary care is commissioned by the CCG. Local governments are responsible for public health, but CCGs collaborate with public health through health and wellbeing boards.
A GP referral is necessary to see a specialist under NHS coverage. The patient has the right to choose the hospital that they are referred to, but not the specialist. Public hospitals are managed as NHS Trusts, or the more independent Foundation Trusts. Hospitals managed by NHS Trusts report directly to NHS management whereas Foundation Trusts have locally elected boards. Most hospitals are now managed as Foundation Trusts. Some privately owned and managed hospitals also provide care within the public system, receiving public moneys from the CCGs.
Britain spends 9.7% of its GDP on health (CAN 10.4%). The Brits spend slightly more with respect to public spending on health as a % of GDP (7.6% vs. 7.4%). Canada spends 3% of total national health expenditures on governance and administration while the Brits spend 2%.
As we have pointed out in previous blogs, Canada underperforms on social spending as a % of GDP. Britain does better in this regard, but still lags behind other developed countries.
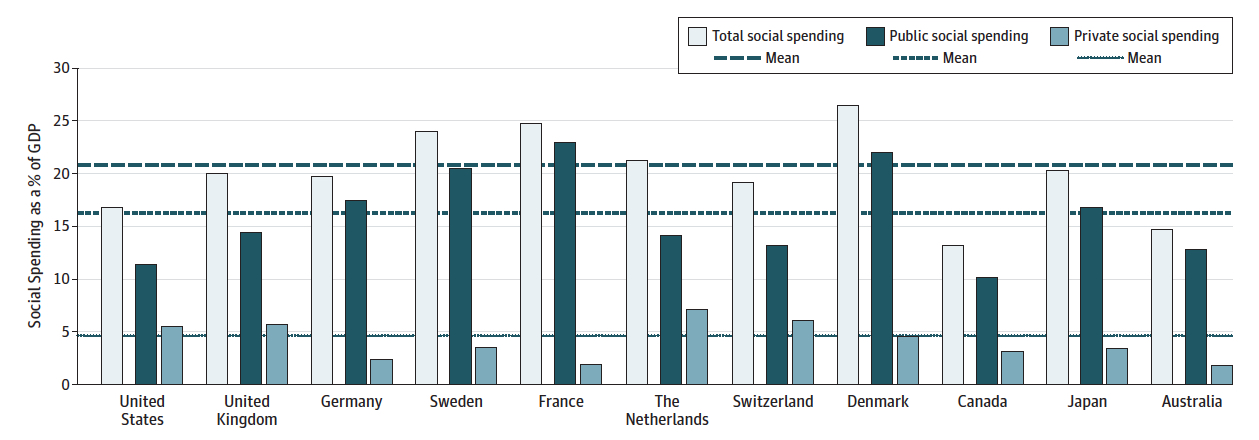
Social Spending as a Percentage of Gross Domestic Product. Source: Health Care Spending in the United States and Other High-Income Countries, Irene Papanicolas, PhD; Liana R.Woskie, MSc; Ashish K. Jha, MD, MPH.
Britain has fewer physicians/1000 population than Canada (2.1 vs. 2.6). Generalist physicians ($134 671), specialist physicians ($171 987) and nurses ($49 894) in Britain are all compensated less than in Canada.
The NHS includes coverage for drugs and some dental care. In Prescription drug coverage: how does Canada compare? Milne et al. describe the NHS system for drug coverage as one of the best in the world. As the authors note, this universal coverage ensures higher patient adherence to drug regimens and reduces patients skipping medications due to cost.
According to The Commonwealth Fund: NHS is #1 System in World
The 2017 Commonwealth Fund rankings on health system performance based on measures of Care Process, Access, Administrative Efficiency, Equity, and Health Care Outcomes found that the NHS was the premier healthcare system in the world. By contrast, Canada ranked ninth, ahead of only France and the USA.
From a Canadian perspective, why did our system (that perhaps more closely resembles the NHS than any other in these rankings) rate so much lower than the NHS?
Indeed, even with its prestigious number 1 ranking, there are homegrown critics of the NHS that tell us it is broken and one of the worst in the western world. Yet the NHS has received this Commonwealth Fund number 1 ranking twice in a row.
According to the Commonwealth Fund report, Canada does particularly poorly in access, equity and health care outcomes. As noted by University of Toronto professor Dr. Raisa Deber in the Globe and Mail when the rankings were released, many of the equity measures focused on elements that are not part of Canadian Medicare – e.g. – universal drug coverage and dental care. Canada naturally fell short in these measures. Providing national pharmacare and dental coverage for all would immediately catapult us dramatically higher in the rankings.
As Dr. Deber also points out, the differences between the best and worst performers on many of the rankings is miniscule. This survey-based methodology is reliant on small sample sizes which can dramatically skew results with only minor deviations. Appendix 7 (Sample Size of Commonwealth Fund International Health Policy Surveys) shows that the UK consistently has some of the smallest sample sizes across every measure in the surveys (sometimes using sample sizes as low as 100). Is the NHS survey response sufficiently representative that one can draw definitive conclusions as to the best performing healthcare system?
Therefore, in this piece, we will try to use a more objective lens in our evaluation of the NHS, while asking further questions of the Commonwealth Fund data and comparing the NHS to Canada’s scores.
Outcomes of Care and Utilization of Services
Life expectancy is nearly equivalent in the two countries (CAN 81.7 vs. UK 81). When examining health expenditure by function of care as a % of total national health expenditure, we observe the following: Britain spends more on long-term care (18% vs. 14%) and inpatient care than Canada (24% vs. 17%), while Canada spends more on outpatient care (36% vs. 30%). Canada has more long-term care beds per population ≥65 (53.7 vs. 49.5) and the countries have the same number of acute care beds per capita (2.7).
Both countries are experiencing difficulty with hospital overcrowding. Like Medicare in Canada, the NHS is facing similar problems with respect to delivering care to an aging population.
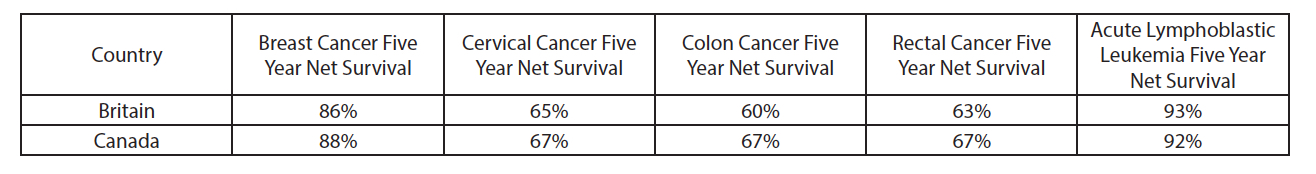
OECD data demonstrates that Canada has marginally better five year net survival rates for cancer than Britain for the outcomes listed below.
Access to Care and Waiting times
The survey data from the Commonwealth Fund helps to describe the shortcomings of the Canadian system in comparison to the NHS. Canada ranked second to last in the area of Access and Britain ranked third. To arrive at their rankings in Access, the Commonwealth Fund used survey data in the following two areas – Affordability and Timeliness.
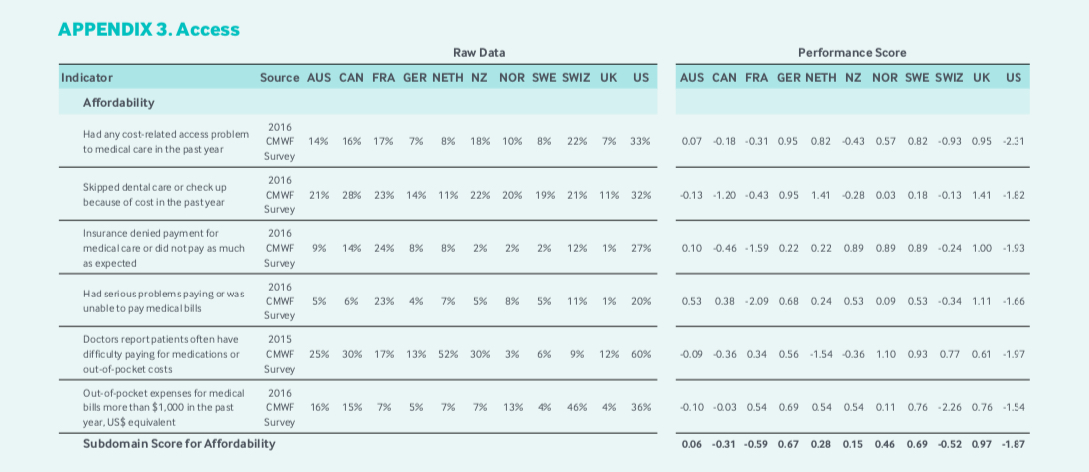
Examining the Affordability ranking performance scores, Canada received its worst scores with respect to survey respondents noting that they had skipped dental care because of cost, and patients having difficulty paying for medications due to cost. Britain scored considerably higher on both these measures. Why? Because the NHS single payer system includes national pharmacare and dental care. If Canada wants to improve Access performance scores according to Commonwealth Fund measurements, we need universal pharmacare and dental care.
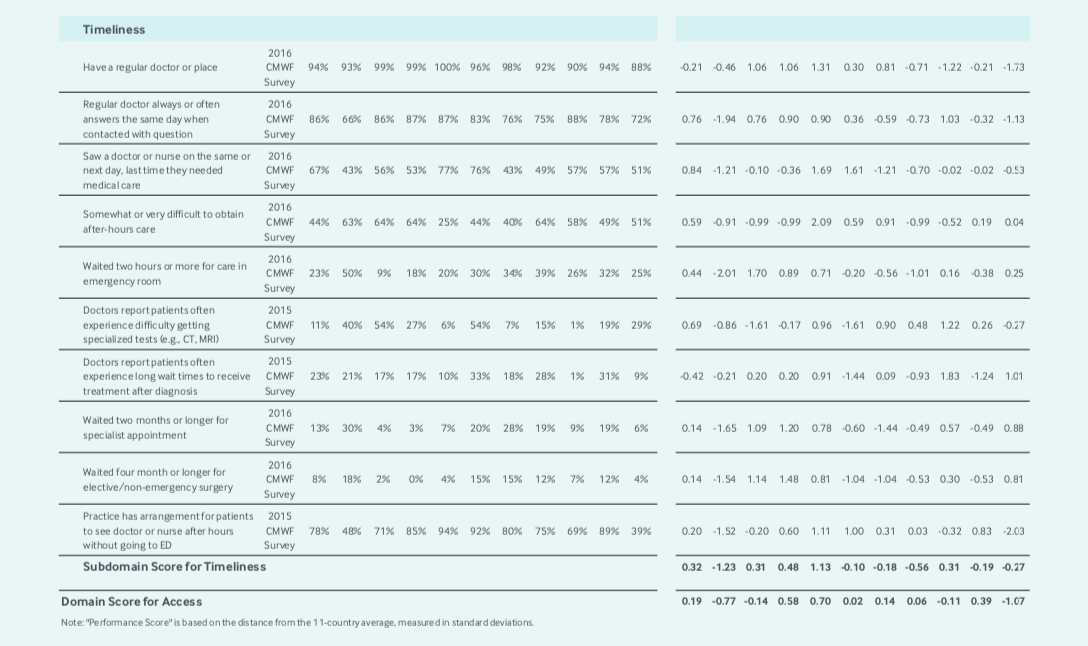
Timeliness performance scores shows that Canada has to do better with emergency room waiting times. The survey results (if the small numbers are credible) also suggest that in the NHS, a patient’s regular doctor was more often available the same day to answer questions, that patients had an easier time making same or next day appointments, and obtaining after-hours care without going to the ER was easier in the NHS. Canada also scores lower on waits for MRI and CT (paradoxically despite having more MRIs and CTs per capita than the NHS), specialist appointments and non-emergency surgery.
Therefore, if we are to accept this survey data, it would suggest that Brits (and most other countries in these rankings) have better access to their primary care physician than Canadians. The bar graph below from Papanicolas et al. shows that despite this finding Canada has a healthy proportion of practicing family physicians in comparison to other countries that consistently outperform us in the Commonwealth Fund rankings on access to primary care measurements.
Part of the problem with access to primary care may relate to maldistribution of physicians across rural/urban divides in Canada. Canada actually has more urban physicians per capita than any wealthy country other than Sweden (Canada 4.1 physicians per 1000 in urban areas, Sweden 4.5, France 4.1, USA 3.2). However, despite 18% of Canadians living in rural regions, Canada has the lowest ratio of rural physicians in the wealthy world (0.4 per 1000 vs. 4.4 in Switzerland and 3.5 in Sweden).
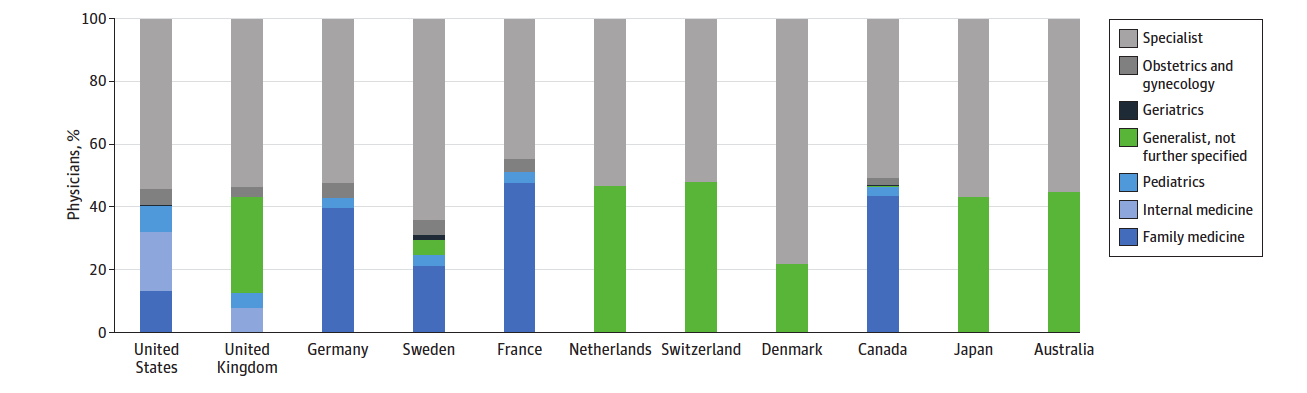
Practicing Physicians by Primary Care Specialization. Source: Health Care Spending in the United States and Other High-Income Countries, Irene Papanicolas, PhD; Liana R.Woskie, MSc; Ashish K. Jha, MD, MPH.
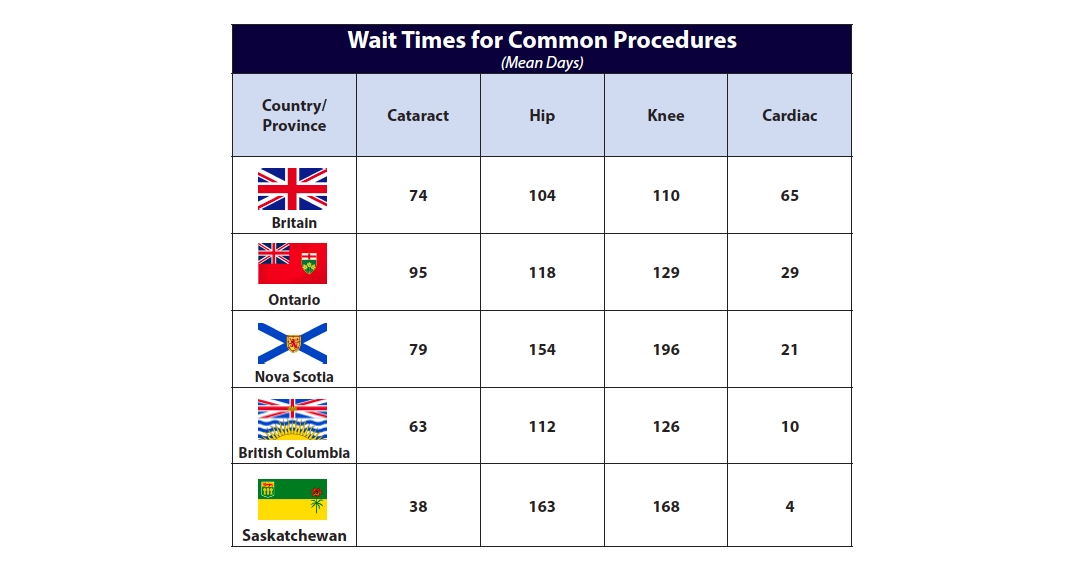
Using data from the OECD for Britain and various provincial sources for Canada, we can compare wait times for common elective procedures. Some Canadian provinces do better with respect to cataract procedures, while Britain has relatively better access to hip and knee procedures. All Canadian provinces provide better access than Britain with respect to wait times for cardiac bypass procedures.
Finding data for British cancer wait times to compare to Canadian cancer waits is challenging. What we can perhaps best compare is the NHS 62-day commitment (urgent GP referral to first treatment) using their Waiting Times for Suspected and Diagnosed Cancer Patients Annual Report compared to Health Quality Ontario’s (HQO) system performance measurements.
HQO measures the time to first surgical appointment (Wait 1) and time from decision to treat to cancer surgery (Wait 2). For example, if we look at breast cancer statistics below from the NHS, 94% of patients were treated within the standard 62-day wait time. If we then look at Priority 3 breast cancer patients (the most common group) on the HQO website, 92% are seen within a target time of 21 days, and 92% are treated within a target time of 28 days. Therefore, 92% of Priority 3 breast cancer patients in Ontario are treated within a cumulative target time of 49 days in Ontario. The same holds true for lung cancer.
Whereas 72% of patients are treated for lung cancer within the NHS 62-day wait time, in Ontario 94% of Priority 3 lung cancer patients are seen within a 21 day target time and 88% are treated within a target time of 28 days from time from decision to cancer surgery. 86% of Gastrointestinal cancer patients are seen within 21 days and 90% of GI cancer patients have surgery within 28 days.
These results seem better in Canada than the NHS. However, it is important to remember that they do not measure gaps between Wait 1 and Wait 2 in the Canadian data (for diagnostic procedures for example) that are included for the NHS 62-day standard.
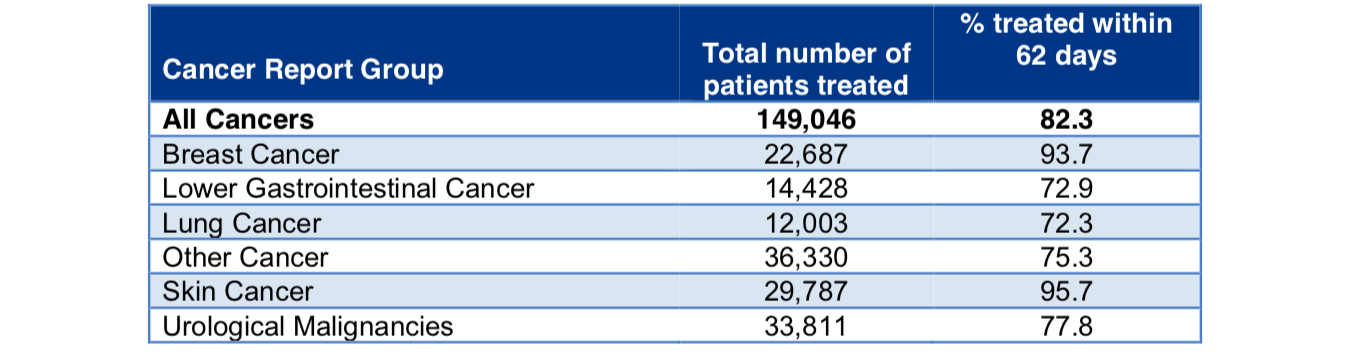
Activity and performance of the two month wait standard for different cancer sites in 2017/18. Source: Waiting Times for Suspected and Diagnosed Cancer Patients 2017-18 Annual Report.
Recently cancer wait times in the NHS have been the subject of debate and scrutiny as they seem to be worsening.
Private Parallel Care in Britain
About 10% of Brits have opted for private health insurance that offers better access to care for elective procedures covered under the NHS. Specialists are allowed to operate in the private space so long as they work at least 40 hours a week as stipulated by their contractual arrangement with the NHS.
Not surprisingly, specialists working in the private system generally take on high-volume, low-risk procedures to supplement their income – hip and knee replacement, cataract, hernia repair, etc. The main advantage for the patient who can afford private care is jumping the NHS queue. Private patients can choose their specialists and avoid waiting lists for non-emergency procedures without a GP referral.
Similar to the Australian system, many private hospitals in Britain lack intensive care units or emergency departments. As a consequence, public hospitals are all too often left to deal with the complicated acute care cases, as well patients transferred over from the private system who are experiencing complications as a result of their procedure.
Like Australia, many NHS public hospitals now have private units that act as a source of income to support hospital budgets. As a result, patients with private insurance are given preference for elective procedures and public system waits can suffer as a result.
Concluding thoughts
These entries are meant to provide insights on other healthcare systems that may provide us with information on how to improve our Canadian system by identifying relative underperformance.
Azeem Majeed et al. have written a thoughtful analysis on how the NHS might improve to achieve better health outcomes. Importantly, the authors recommend better integration and communication between primary care and specialist services, as well as more investment in specialist services to reduce wait times. They note that investment in specialist services requires attention to appropriateness.
The Canadian Institute for Health Information (CIHI) and Choosing Wisely Canada (CWC) have shown that up to 30% of Canadian medical services may be unnecessary.
The comparison with the NHS confirms that Canada needs national pharmacare. In addition to enhancing equity, a national system could save on drug costs that could be effectively reinvested into other health services.
The Canadian and British healthcare systems have much in common. Most importantly, they are rooted in the fundamental principle that care should be based on clinical need, not ability to pay. Both systems are facing current challenges that will invite consideration for further private investment in healthcare delivery.
The British already offer parallel private care and there are constitutional challenges ongoing to the Canada Health Act that seek to do the same here. Data on wait times from the NHS do not show that public wait times are better than Canada’s based on the NHS allowing private payment for access. It is important to remember this observation as the debate about private care continues in Canada.
Image Credit: ©miluxian – Can Stock Photo Inc.